Figure 2.
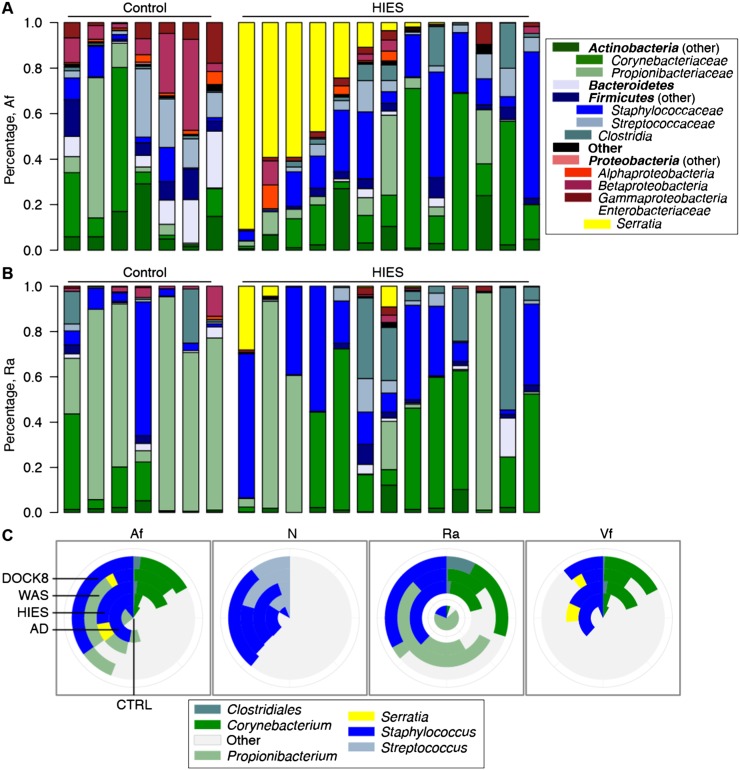
Bacterial taxonomic classifications show colonization with unique taxa and altered representation of diverse taxa. Relative abundances of 14 major phyla-family taxonomies in the antecubital fossa (Af) are shown in A and retroauricular crease (Ra) in B. Shown are seven representative healthy controls and all Sanger-sequenced STAT3-HIES patients. Full versions of all skin and nares sites are in Supplemental Figure S4. (C) Inlaid pie charts compare the mean relative abundances of major skin genera across patient groups. Mean ± SEM for C are shown in Supplemental Figure S5 and Supplemental Tables S9 and S10. Patient identifiers are in Supplemental Table S13.

