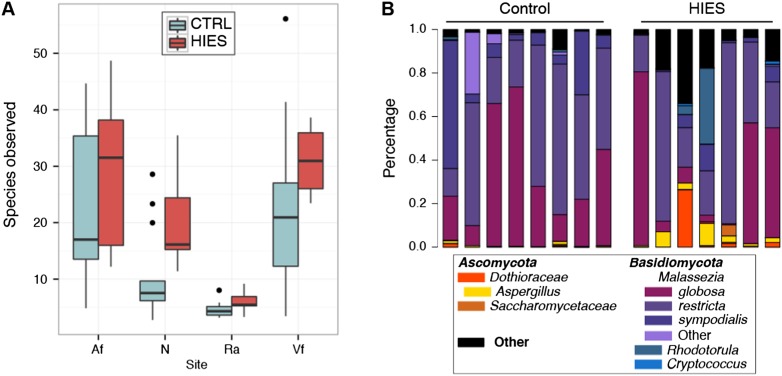
Figure 6.
Characterization of fungal skin communities suggest increased permissivity and elevated levels of opportunistic pathogenic fungi. (A) Boxplots showing fungal richness (species observed) of STAT3-HIES versus controls at all sites; black bars indicate median. (B) Select ITS1 fungal taxonomic classifications for the antecubital fossa, grouped by patient category. Full versions of all skin and nares sites are shown in Supplemental Figure S8. Patient identifiers are in Supplemental Table S13.

