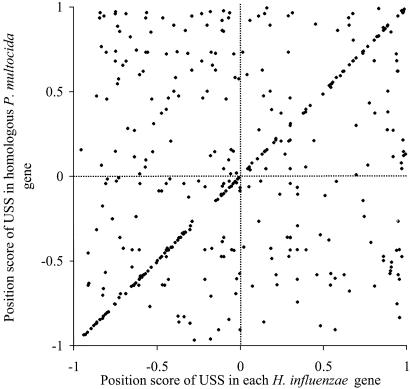
Fig. 3.
Relationship between positions and orientations of H. influenzae and P. multocida USSs within homologous genes (see text and Fig. 2 for detailed explanation of the analysis). Each point represents a single intragenic USS comparison. Positive and negative values reflect USSs orientation with respect to the direction of transcription.

