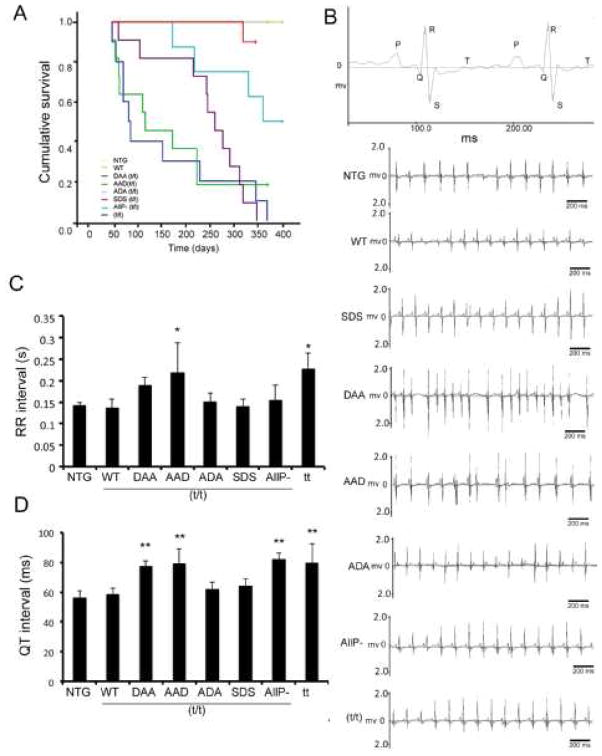
Figure 6.
Residue-specific mutation of the phosphorylation sites leads to decreased survival probability and conduction abnormalities. A) Kaplan-Meier curve of the different TG lines. NTG, WT and ADA were indistinguishable (n=8–11). B) Representative surface ECG recordings of TG mice showed irregular RR and QT intervals in DAA/(t/t) and AAD/(t/t) hearts. C) Quantitation of the RR intervals (n=6–8). D) Quantitation of QT intervals (n=6–8). Data are expressed as mean ± SD. *P<0.05, versus WT/(t/t), †P <0.0001 versus WT/(t/t).

