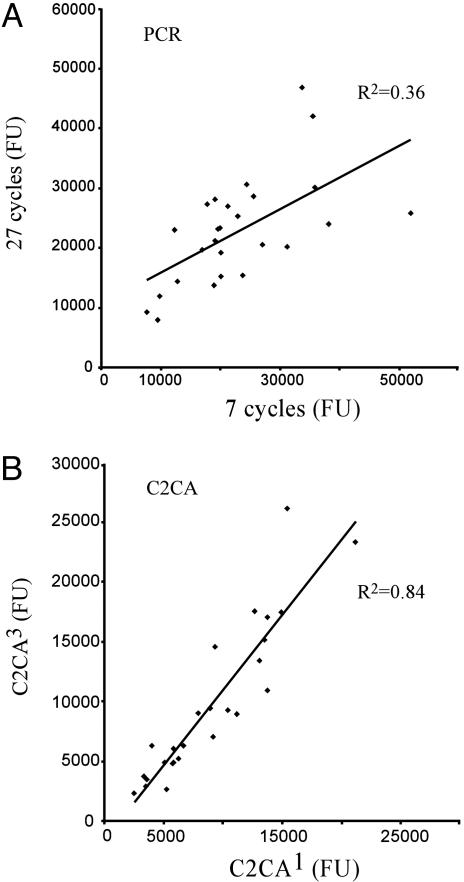
Fig. 4.
Preservation of the proportion of amplification products after million-fold amplification by C2CA or PCR. (A) A pool of 26 different of DNA circles was subjected to one generation of C2CA or they were diluted one-million-fold and amplified in three generations of C2CA. The products were then analyzed on tag microarrays. (B) The same sets of circles were amplified in 7 or 27 cycles of PCR and then analyzed in the same manner. Fluorescence values of the amplification products were plotted in two graphs with results from the undiluted pool of circles on the x axis and the million-fold dilution on the y axis. The correlation coefficients for the two dilutions are indicated for each amplification procedure.

