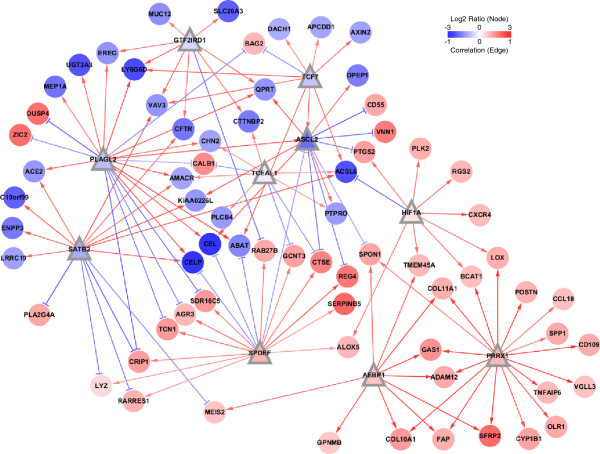
Figure 2.
The transcriptional network between the top 10 TFs and the signature genes by MRA + SLR method. Node shape is triangular for TFs and circle for target signature genes. Node color represents the log2 ratio of gene expression between the poor and the goop prognostic group in the Moffit cohort (n = 177). Arrow shapes represent regulatory modes determined by the sign(+/−) of Spearman’s rank correlation between a TF and its target gene. Edge color represents the magnitude of correlation.

