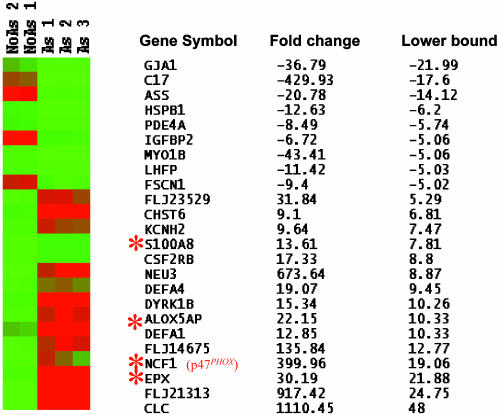
Fig. 1.
Microarray analysis of NB4 cells before and after arsenic treatment. Expression profiles of the 24 genes (with the lower bound fold change of the 90% confidence intervals ≥5) were shown across the five samples in Eisen's heat map. No As, untreated NB4 cells; As, arsenic-treated NB4 cells. Red and green colors represent high and low expression levels, respectively. The corresponding gene symbols, fold changes, and the lower bound fold change of the 90% confidence intervals are also listed. –, down-regulated gene expression. Those genes related to ROS production were marked with an asterisk. The genes are ordered from the most down-regulated genes to the highest up-regulated genes, based on the lower bound fold change.

