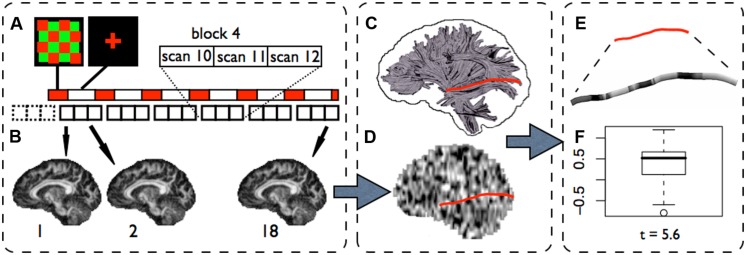
FIGURE 2.
The fDTI method (visual experiment). (A) In the fDTI experiment 1+6 blocks of 3 DTI scans are acquired. The first block (dashed lines) is a dummy block added to correct for possible scanner onset effects and is disregarded in the further analysis. The necessity for the lag between task and scans is explained in Figure 2. For each of the 18 DTI scans an FA map is computed (B). A statistical parameter map (SPM) is computed (D) on the FA maps using a general linear model. Fiber tracts are reconstructed for the complete brain (C) and, for each tract, the t-values found in the SPM along that tract were grouped into a single set of t-values (E). For each tract a statistical test (student’s t-test) is done (F) on the set of t-values to test if the average t-value found along the tract is significantly (t > 5) greater then zero.

