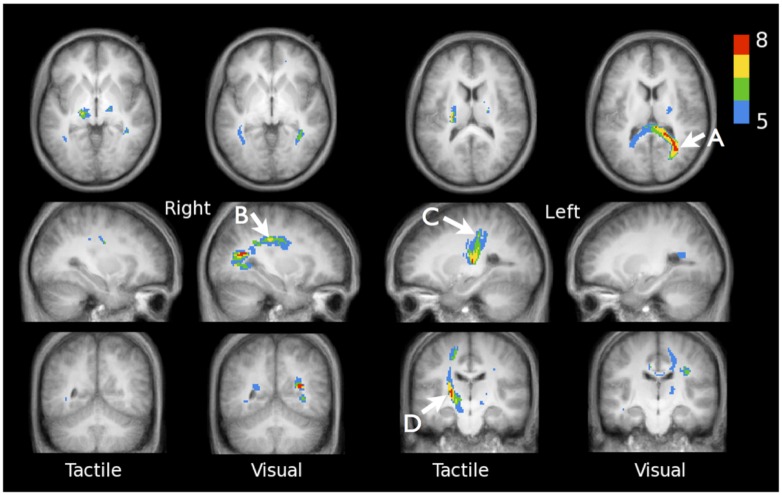
FIGURE 4.
Accumulated fDTI results of all 12 individuals for the tactile and visual tasks. For both tasks the cumulative fDTI results were computed and overlaid on the subjects’ average anatomy. The value of a (colored) voxel represents the minimum number of subjects for which active fibers are found at that position. Visual activation is found for tracts that are part of the forceps major (A) MNI-coordinate (31, -58, 16), superior longitudinal fasciculus (B) MNI-coordinate (31, -24, 34), and at positions that correspond with the optic radiations. The results show that the majority of the tactile activation is found in the contralateral tracts connecting the thalamus and sensory cortex. Maximum cumulative values are found at MNI-coordinates (-27, -30, 34; C) and (-19, -22, -3; D).

