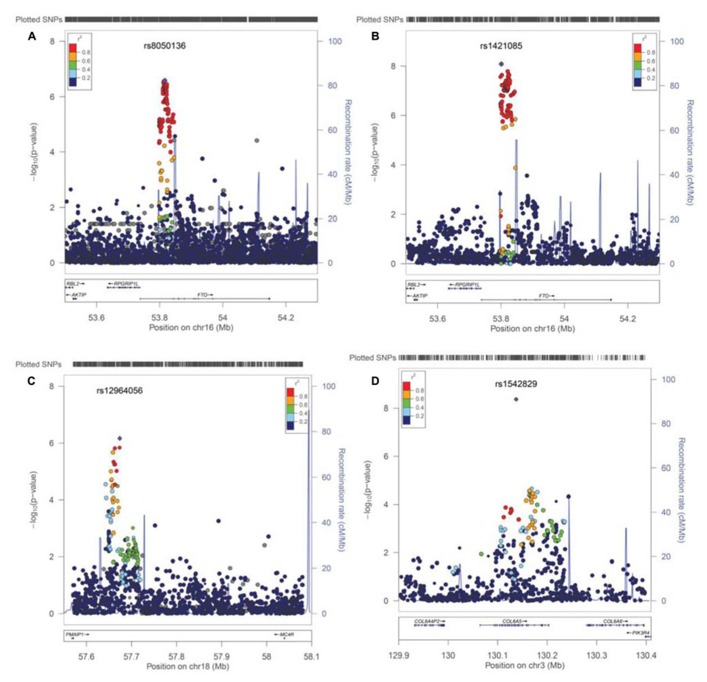
FIGURE 3.
Post imputation results on selected regions. (A) Imputation results and signal at FTO locus contributing to BMI. SNPs are plotted by position in a 0.2 Mb window of chromosome 16 against association with BMI-z (-log10 P-value). The panel highlights the most significant SNP in a meta-analysis using an additive model. Estimated recombination rates (from HapMap) are plotted in cyan to reflect the local LD structure. The SNPs surrounding the most significant SNP (rs8050135), are color-coded to reflect their LD with this SNP (taken from pairwise r2 values from the HapMap CEU database, www.hapmap.org). Regional plots were generated using LocusZoom (http://csg.sph.umich.edu/locuszoom). (B) Regression results at the FTO locus under recessive model, best marker = rs1421085, p(rec) = 8.21 × 10⁻⁹. (C) Imputation results near the MC4R locus at chromosome 18, is shown. Best marker rs12964056, p = 6.87 × 10⁻⁷, z = -4.98. (D) A new effect at the COL6A5 locus in chromosome 3. Best marker rs1542829 p = 4.35 × 10⁻⁹, z = 5.889.

