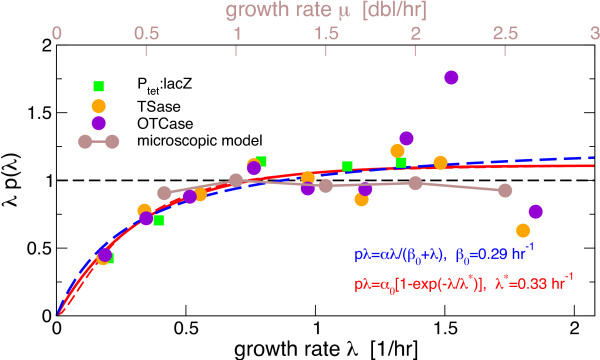
Figure 1.

Growth-rate dependence of the product p×λ of the concentration of an unregulated protein (p) and the growth rate (λ). For stable proteins, this product corresponds to the protein synthesis rate. The lines show the predictions from models with dilution only (dashed black), dilution plus growth rate independent degradation (blue) and dilution plus growth rate dependent synthesis (red), the latter two are fitted to the data with the indicated pmeters. The dashed red line modifies the last case by also including a small degradation rate. The data is a compilation of growth-dependent concentration of several unregulated proteins from ref. [1]. The concentrations are normalized to their value at 1 doubling/hour.
