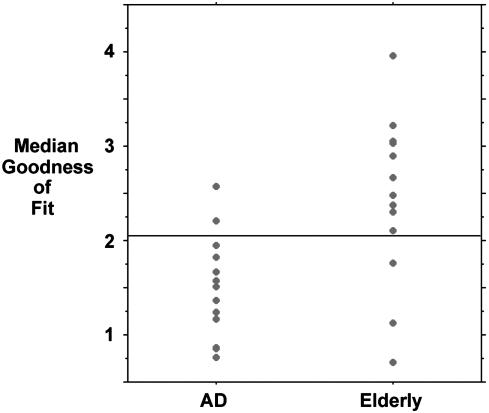
Fig. 5.
Individual scores for goodness of fit to standard default-mode network. A scattergram shows the median goodness of fit for each subject in the AD and healthy elderly groups using the Stanford University ICA-derived default-mode template. The group means were significantly different in a two-sample t test (P < 0.01). The horizontal line indicates a cutoff point of 2.1 where 11 of 13 AD subjects and 10 of 13 elderly subjects are correctly categorized, yielding a sensitivity of 85% and a specificity of 77%.

