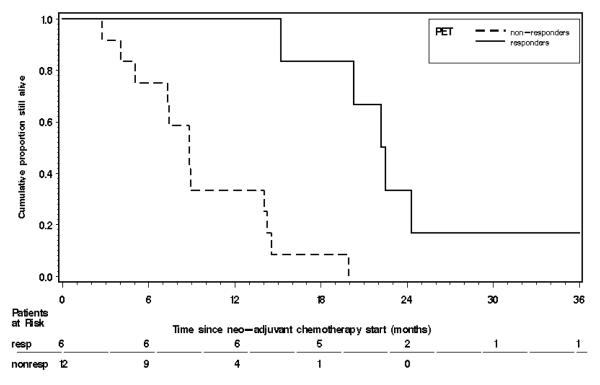
Figure 1.
Overall survival curve for PET responders vs. non-responders using the Patlak model. The one long (and censored) survival time of 83.6+ months was truncated to 36 months to produce a more compact graph. The 1-year survival rate for the six PET responders was 87% (with 90% CL = ( 0.67, 1.00), and for the twelve PET non-responders was 28% (with 90% CL = ( 0.07, 0.49).

