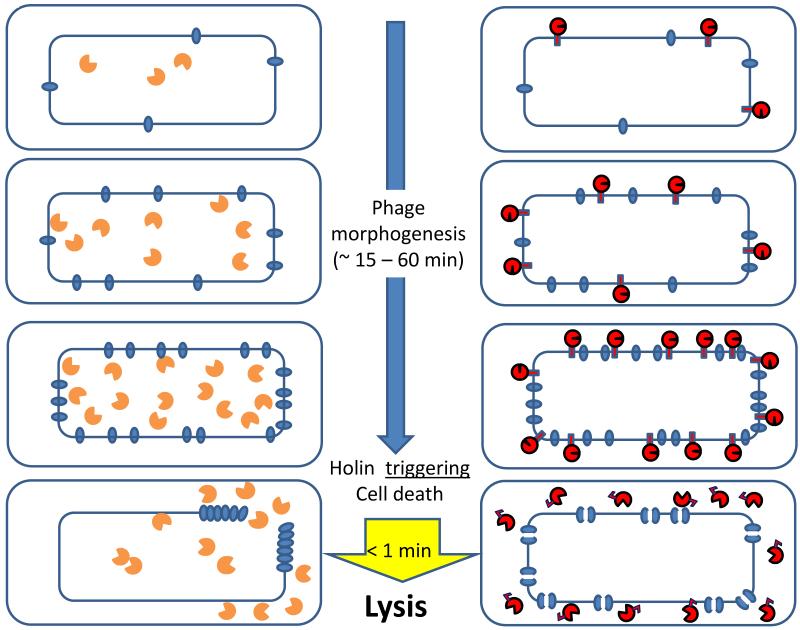
Figure 2. The two pathways for phage lysis in Gram-negative hosts.
Schematic views of the holin-endolysin (left) and pinholin-SAR endolysin (right) pathways to lysis, beginning at the onset of late gene expression (phage morphogenesis) period. The inner (IM) and outer membranes (OM)of cells are shown, with holin or pinholin (blue ovals) accumulating in the IM. In the bottom figures, upon reaching a critical concentration, the holin triggers to form a large micron-scale hole (left). In contrast, the pinholin triggers to from many heptameric pinholes (represented by double ovals with a channel).
The orange symbols with the open “active site” represent the enzymatically active canonical endolysin accumulating in the cytosol. The red symbols with the closed and open “active sites” represent the inactive SAR endolysin accumulating in the IM and the activated SAR endolysin released into the periplasm, respectively.

