Figure 1.

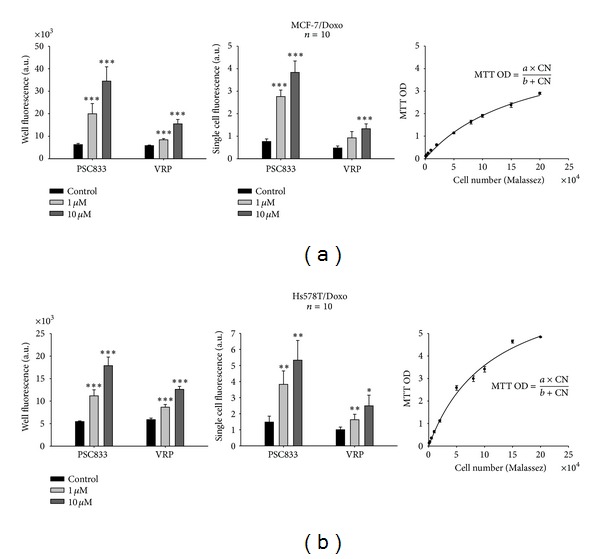
Effects of P-glycoprotein blockers on calcein-AM efflux obtained by quantifying whole well or cell-normalized well fluorescence with a microplate reader. P-gp activity was measured as the ability to efflux the fluorescent P-gp allocrite calcein-AM. MCF-7/Doxo (a) or Hs578T/Doxo (b) multidrug resistant P-gp overexpressing breast cancer cell lines were incubated with 0, 1, or 10 μM of the P-gp antagonists verapamil (VRP) or PSC833. Left: global cell population P-gp activity was quantified by measuring whole well fluorescence (arbitrary units, A.U.) in 6-plicates for 10 repeated experiments in each condition. Middle: a normalized single cell P-gp activity (A.U.) was obtained from cell population in each well by computing the ratio of whole well fluorescence to the number of cells in the corresponding well. In this respect, an MTT assay was systematically performed after the fluorescence readings to determine the number of cells in each well of the microplate. Right: MTT calibration curves. MTT optical density (MTT OD) varied as a function of the number of cells (NC) deposited in the wells, in a saturation type Mickaelis-Menten relationship. For calibration, the number of cells was determined by using a Malassez counting chamber. Curve fitting to the data gave the following parameters: a = 5,27; b = 175092 for MCF-7/Doxo cells and a = 7,64; b = 113025 for Hs578T/Doxo cells, respectively. Data are presented as mean ± sem with n = 10 independent assays per data point. Results significantly different from the control are indicated (*P < 0,05; **P < 0,01; ***P < 0,001; paired Student's t-test).
