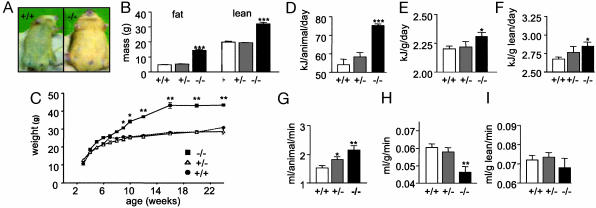
Fig. 2.
Phenotype of Pomc-/- mice. (A) Pomc-/- mice develop obesity and have a lighter coat color compared with a sex- and age-matched 4-month-old wild-type littermate. (B) Fat and lean mass were determined by dual-energy x-ray absorptiometry (DEXA) of group-housed 2- to 3-month-old male mice. The data represent the means ± SEM. n = 5 for each genotype. ***, P < 0.001 compared with wild-type mice. (C) Body weights of group-housed male mice on low-fat diet (wild-type, n = 10; Pomc+/-, n = 10; Pomc-/-, n = 4). Body weight of Pomc-/- mice is statistically different from wild type (*, P < 0.05 at 10 weeks, reaching **, P < 0.01 at 24 weeks). There is no difference between growth curves of wild-type and Pomc+/- mice. (D) Food intake of individually housed 2-month-old male mice maintained on a low-fat diet (n = 8 for each genotype). Data were corrected for total body mass (E) and lean body mass (F). Pomc-/- vs. wild-type mice, *, P < 0.05, ***, P < 0.001. (G) Oxygen consumption in 3-month-old male mice was determined by indirect calorimetry as described (n = 5 for each genotype). Data were corrected for total body mass (H) and lean body mass (I). Pomc-/- vs. wild-type mice, *, P < 0.05, **, P < 0.01.

