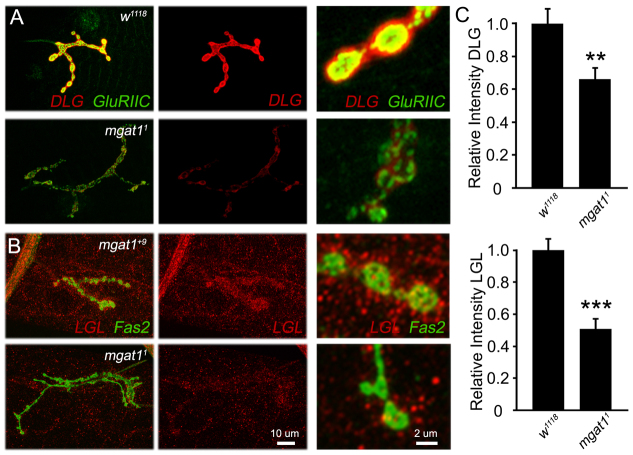
Fig. 8.
Synaptic scaffolds DLG1 and L(2)GL reduced in the Mgat1 null mutants. Imaging of DLG1 and L(2)GL synaptic scaffolds at the wandering third instar NMJ. (A) Representative images of DLG1 (red) co-labeled with glutamate receptor type IIC (GLURIIC, green), with higher magnification boutons in side panels. (B) Representative images of L(2)GL (red) co-labeled with Fas2 (green), with high-magnification boutons in side panels. (C) Quantification of DLG1 fluorescence intensity (top: Mgat11, n=15; w1118, n=22) and L(2)GL fluorescence intensity (bottom: Mgat11, n=12; w1118, n=12). **P≤0.01 and ***P≤0.001 (Student’s t-test) for pairwise comparisons.

