
Figure 1.
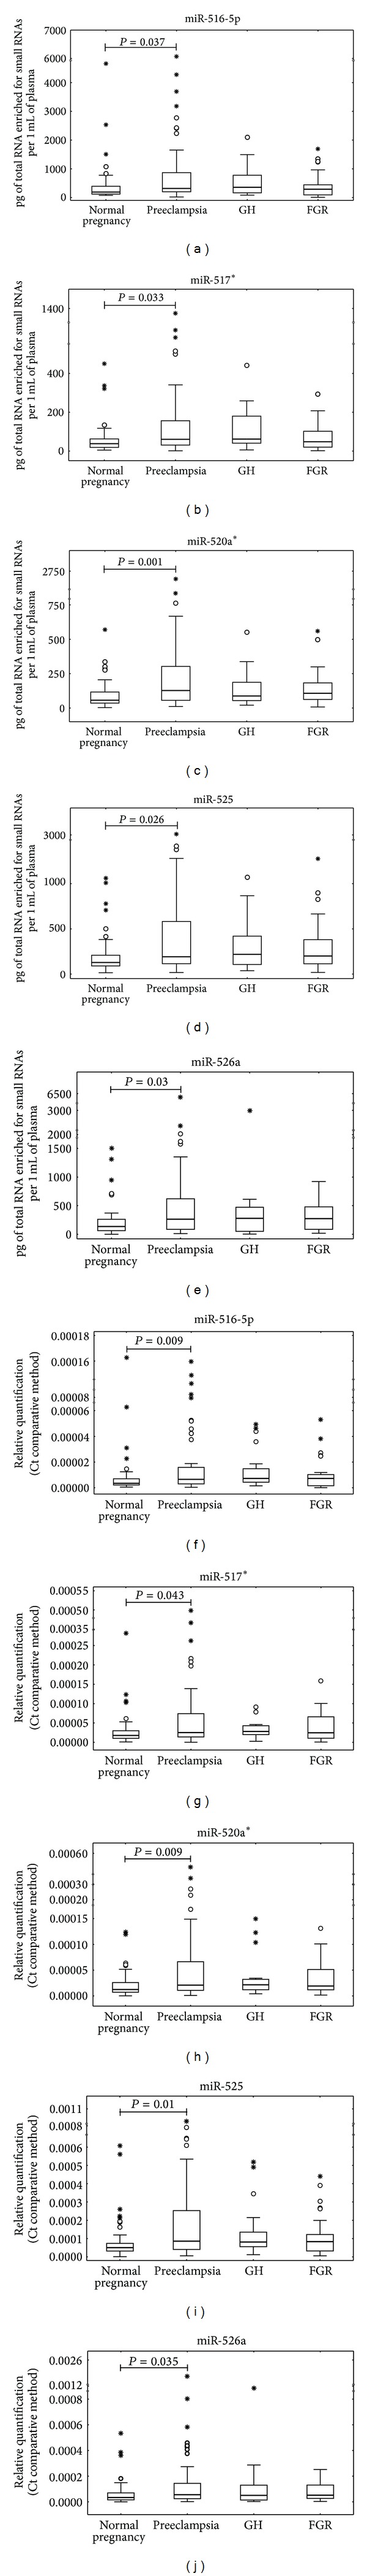
Upregulation of circulating C19MC microRNAs in pregnancies with preeclampsia. Absolute ((a), (b), (c), (d), and (e)) and relative ((f), (g), (h), (i), and (j)) quantification data were expressed as box plots of individual microRNAs in cohorts of normal and complicated pregnancies using Statistica software. The upper and lower limits of the boxes represent the 75th and 25th percentiles, respectively. The upper and lower whiskers represent the maximum and minimum values that are no more than 1.5 times the span of the interquartile range (range of the values between the 25th and the 75th percentiles). The median is indicated by the line in each box. Outliers are indicated by circles and extremes by asterisks.