
Figure 1.
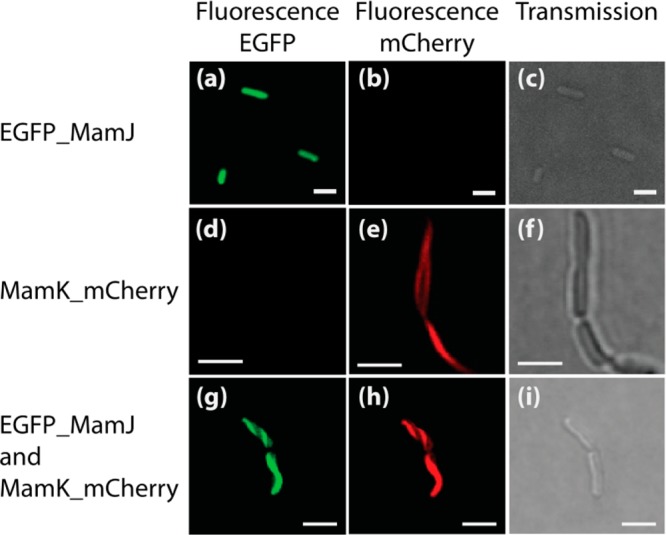
Fluorescence images (a, b) and transmission image (c) of E. coli expressing eGFP_MamJ; fluorescence images (d, e) and transmission image (f) of E. coli expressing MamK_mCherry; and fluorescence images (g, h) and transmission image (i) of E. coli expressing eGFP_MamJ and MamK_mCherry. The excitation and emission wavelengths were 488 and 500–550 nm (a, d, g) and 561 and 570–620 nm (b, e, h). Scale bar 2 μm.