
Figure 3.
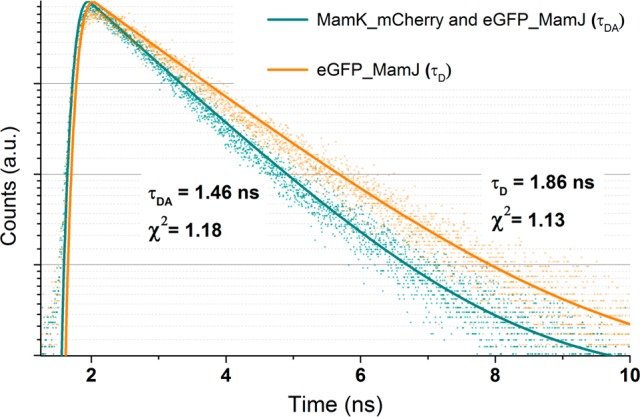
Fluorescence lifetime decay curves of eGFP in E. coli expressing MamK_mCherry and eGFP_MamJ (blue points, bottom) and in E. coli expressing eGFP_MamJ (orange points, top). Single-exponential function best fitting the data points (lines).
Official websites use .gov
A
.gov website belongs to an official
government organization in the United States.
Secure .gov websites use HTTPS
A lock (
) or https:// means you've safely
connected to the .gov website. Share sensitive
information only on official, secure websites.
Fluorescence lifetime decay curves of eGFP in E. coli expressing MamK_mCherry and eGFP_MamJ (blue points, bottom) and in E. coli expressing eGFP_MamJ (orange points, top). Single-exponential function best fitting the data points (lines).