
Figure 4.
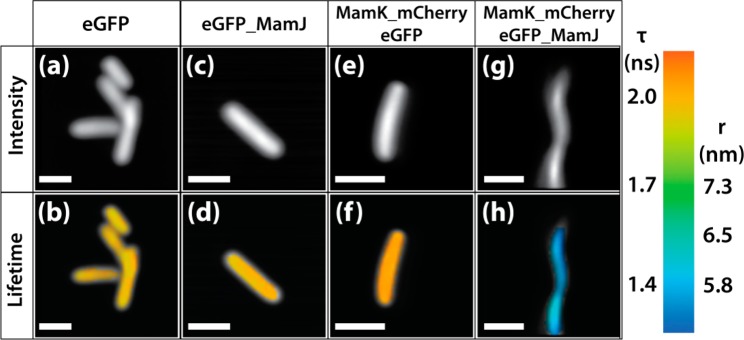
Fluorescence intensity and fluorescence lifetime images of E. coli expressing eGFP (a,b); eGFP_MamJ (c, d); MamK_mCherry and eGFP (e, f); and MamK_mCherry and eGFP_MamJ (g, h). The color-coded scale bar is used to map the fluorescence lifetime of eGFP and the separation distance between eGFP and mCherry calculated. The fluorescence lifetimes range from 1.3 ns (blue) to 2.1 ns (red) and the separation from 5.5 nm (blue) to 7.3 nm (green). Scale bar 2 μm.