
Figure 5.
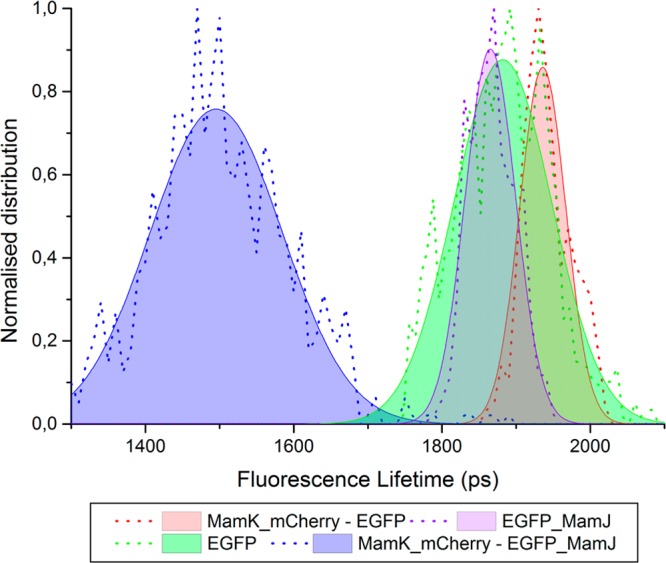
Distribution of the fluorescence lifetime values (dotted lines) fitted to a Gaussian function (filled area delimited by a line) of the E. coli strains expressing eGFP (green); eGFP_MamJ (purple); MamK_mCherry and eGFP (red); and MamK_mCherry and EGFP_MamJ (blue).