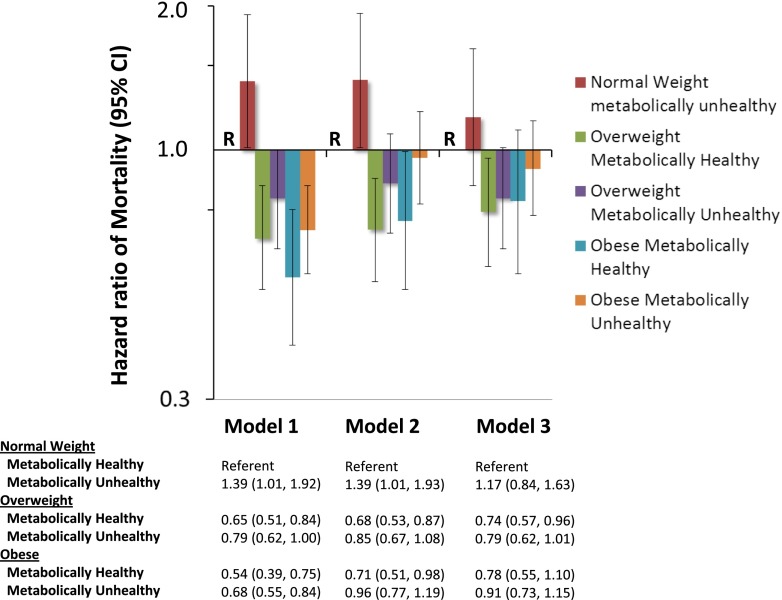
Figure 1.
Unadjusted and multivariable-adjusted hazard ratios of mortality (95% confidence intervals) according to weight and metabolic subtypes. Model 1 is unadjusted. Model 2 is adjusted for age, sex, and geographic region of residence. Model 3 is adjusted for variables in model 2 plus lifestyle factors (self-reported physical activity, current smoking), comorbidities (history of coronary heart disease and stroke), educational achievement (< versus ≥ high school diploma), annual family income (< versus ≥$20,000 per year), natural log-transformed urinary albumin to creatinine ratio, and estimated GFR. Metabolically healthy individuals with normal weight are the referent group (R) in all models. Vertical bars represent 95% confidence intervals.

