
Figure 2.
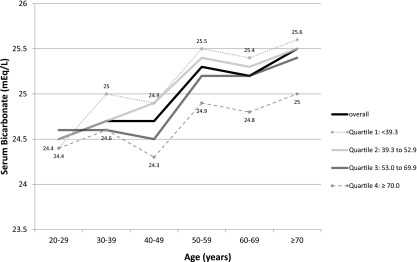
Mean serum bicarbonate levels across age categories, overall, and within quartiles of estimated net endogenous acid production (NEAP; mEq/d) in 9781 participants of the National Health and Nutrition Examination Survey 1999–2004. Individual lines represent the overall population and individual NEAP quartiles. Within each age category, the mean serum bicarbonate is listed for the highest and lowest quartile of NEAP.