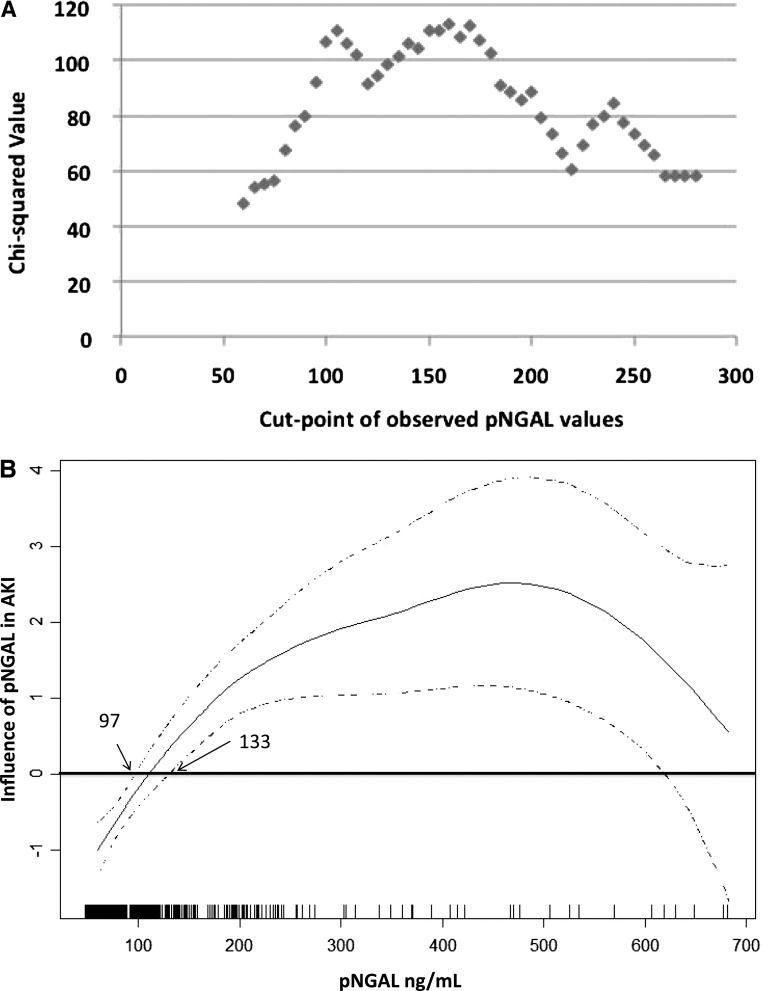
Figure 3.
Determination of a gray zone for plasma neutrophil gelatinase-associated lipocalin (pNGAL). A shows the resulting plot of minimum P value approach. Chi-squared values measuring the association between AKI and dichotomized pNGAL are plotted as a function of different pNGAL cutoff points. The shape of the plot (a bimodal curve for pNGAL values under 200 ng/ml) suggests the existence of a gray zone. B shows the functions estimated by the generalized additive models considering pNGAL concentrations at T12 of the study (the best point as a biomarker performance). Each vertical line on the x axis represents a 12-hour pNGAL value for individual patients with AKI. The zone where the confidence intervals contain the zero value was considered to be the gray zone, corresponding to 97 ng/ml on the lowest point and 133 ng/ml on the highest point.

