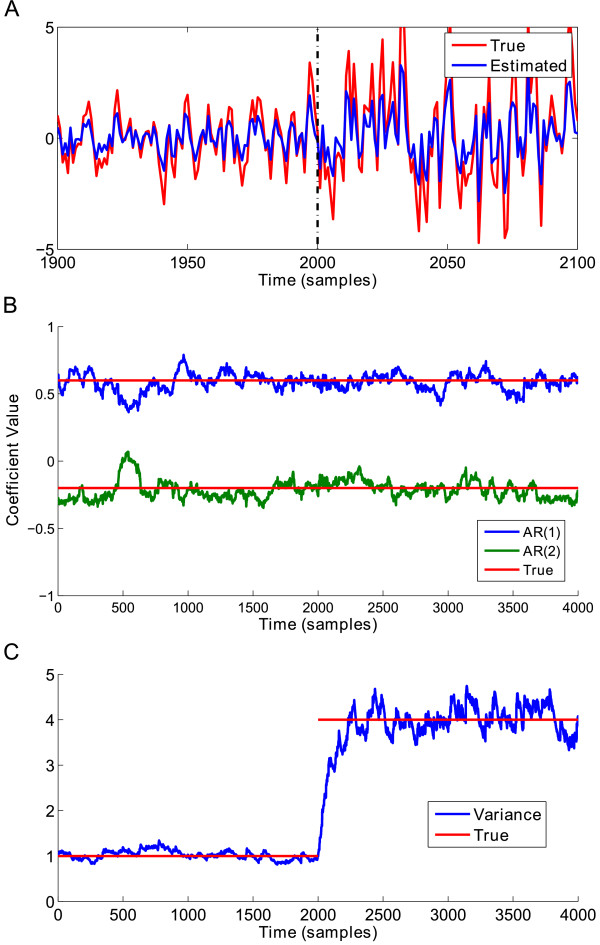
Figure 5.
AR model 2 simulation results. (A) A plot of the simulated AR(2) signal for the time range [1900, 2100] for readability. Blue = original signal, Red = estimated signal, Dashed vertical line: time of the change point at t = 2000. (B) The plot of the estimated AR(2) coefficients over-plotted with the known true value of the AR(2) coefficients. (C) The plot of the estimated variance σ2 over-plotted with the known true value of the variance.

