Figure 6.

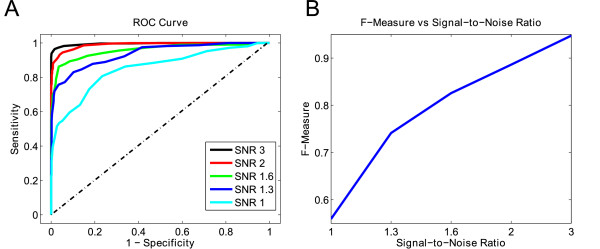
Alpha spindle detection performance on simulated data. (A) Plot of the ROC curves for each of five different SNR values at β = 2. (B) Plot of the F-measure versus the SNR.

Alpha spindle detection performance on simulated data. (A) Plot of the ROC curves for each of five different SNR values at β = 2. (B) Plot of the F-measure versus the SNR.