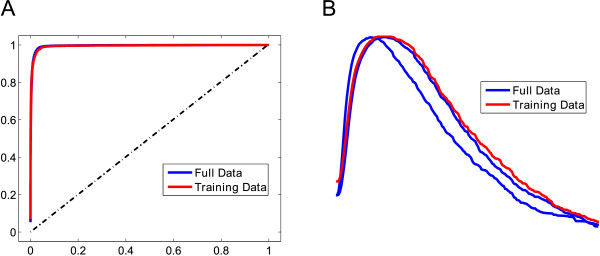
Figure 7.

Alpha spindle detection performance on real data. (A) Plot of the ROC curve for the alpha spindle detection algorithm for the Full Data and Training Data of Driving Data 1 using a fuzzy window parameter of 100 ms. (B) The corresponding modified F-measure plot for the ROC curves shown in (A).
