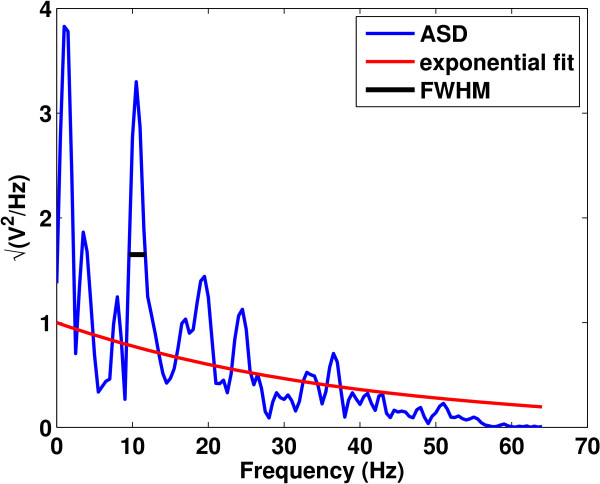
Figure 9.
An illustration of the technique used in [11]for detecting alpha spindles in EEG. The blue curve is the Amplitude Spectral Density (ASD), the red is the exponential fit to the data, and the black line is the full-width at half maximum (FWHM) of the peak amplitude.

