
Figure 4.
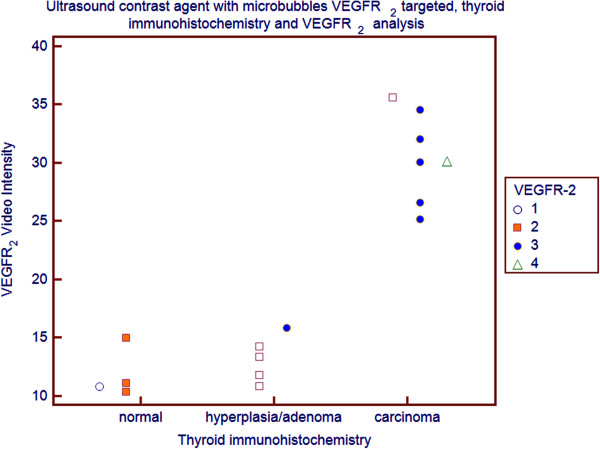
Video Intensity Difference of VEGFR-2 targeted microbubbles and expression of VEGFR-2 determined by Immunohistochemistry expressed as the average percentage of positively stained cells in normal thyroids, in hyperplasia/adenoma and in carcinomas [white dot: no staining (< 5% positive cells); orange square: low/weak (≥ 5% - ≤ 25% positive cells); blue dot: medium/moderate (> 25% - < 50% positive cells); triangle: high/ strong (≥ 50% positive cells)]. The correlation was assessed by the Spearman coefficient.