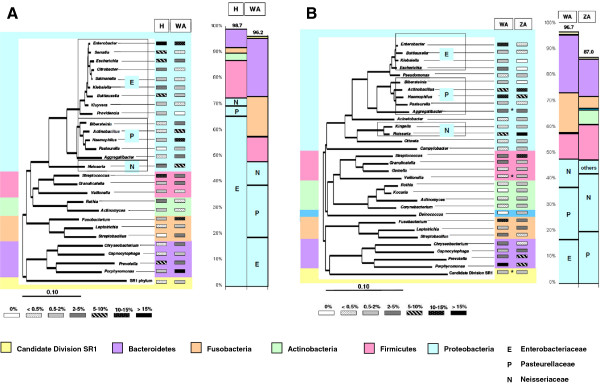
Figure 2.

Relative abundance of predominant genera (> 0.5%) indicated by with gray scale values with significant differences in: A, African humans (H) compared to sanctuary apes (WA); B, sanctuary apes (WA) compared to zoo apes (ZA). Non-significant differences are indicated by asterisks. The phylogenetic tree was calculated with representative full-length sequences as implemented in the ARB program package [46] using the Jukes-Cantor correction. The scale bar represents evolutionary distance (10 substitutions per 100 nucleotides). Bacterial phyla are indicated by different colors; the vertical bars on the right of each plot indicate the relative abundance of each phylum, as marked by the colors.
