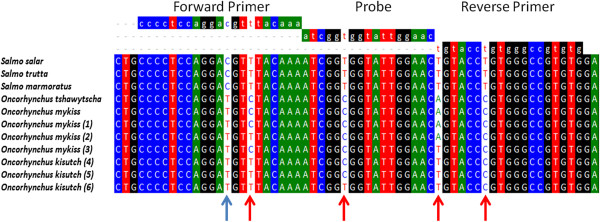
Figure 1.

Analysis of nucleotide variation between different salmonid species. A multiple alignment was made using ClustalW [23] using the Bioedit software [24]. Top, primers and probe used in the current assay (ELF1α) [14]. The first 5 species sequences are available in the GenBank database; S. salar [BT060430], S. marmoratus [EU853442], S. trutta [EF406271], O. tshawytscha [FJ890356] and O. mykiss [AF498320]. Samples labeled with numbers from 1 to 6 were representative of sequences obtained from Oncorhynchus samples in this work. Blue arrow shows the Intragenus conserved variation and red arrow show the Intragenus non-conserved variations.
