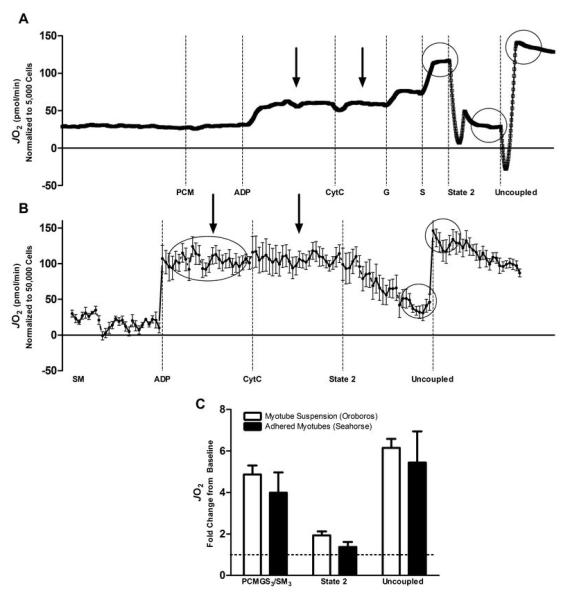
FIGURE 1.
Representative oxygen consumption tracings from permeabilized primary human myotubes using high resolution respirometry in non-adhered (Panel A; Oroboros Oxygraph 2K) and adhered (Panel B; Seahorse Flux Analyzer XF-24) myotubes. Data for both methodologies are normalized to cell count. Arrows indicate a lack of Cytochrome C response confirming intact mitochondria and circles identify comparable data points for each method. Abbreviations are as presented in Table 2. The relative change over State 4 respiration for the comparable data points is presented in Panel C where the dotted line represents State 4 respiration.

