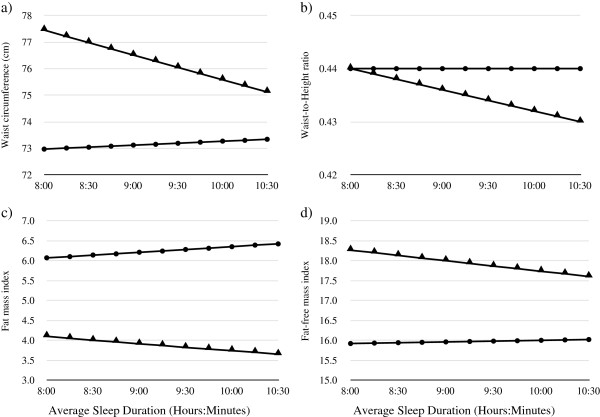
Figure 2.
Visual representation of the significant interaction between sex and average sleep duration for a) waist circumference; b) waist-to-height ratio; c) fat mass index; and d) fat-free mass index in boys and girls. Figures display results for a 16-year old from a high decile school. Results are plotted for the fully adjusted model and include the relevant sex by sleep variable interaction term (model 3). (P < 0.05 for interaction in all four graphs) ● Girls ▲ Boys.

