Figure 1.

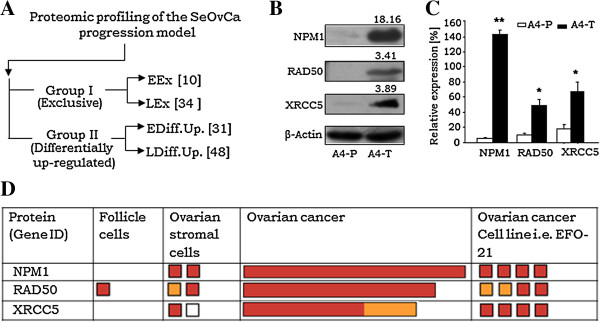
Validation of NPM1, RAD50 and XRCC5 expression in ovarian cancer. A. Schematic demonstration showing proteomic profiling of SeOvCa progression model which leads to derivation of two expression groups; Group I comprise qualitative expressions, while Group II consist of differentially upregulated proteins. (Groups were further divided in two sub-groups of A4-P and A4-T cells). B. Representative immunoblot validating qualitative expression of NPM1, RAD50 and XRCC5 proteins in A4-T cells over A4-P cells; numbers indicate mean fold-change values. C. Quantitation of NPM1, RAD50 and XRCC5 proteins expression levels. D. Expression levels of NPM1, RAD50 and XRCC5 proteins in ovarian cancer samples and cell line (i.e. EF0-21) analyses in HPA database (http://www.proteinatlas.org). Expression levels of NPM1, RAD50 and XRCC5 proteins were analyzed in 11, 9 and 6 tumors respectively, derived from high grade serous adenocarcinoma patients (HPA accession nos. ENSG00000181163, ENSG00000113522 and ENSG00000079246 respectively). The red, yellow and light brown colour boxes showing strong, moderate and weak expression (antibody staining intensity) of these targets in the HPA database, while white box represents negative expression. The length of boxes in ovarian cancer indicates overall cancer tissue staining statistics in percentage. Data is indicated as mean ± SE of triplicate experiments. *p <0.05,**p <0.01.
