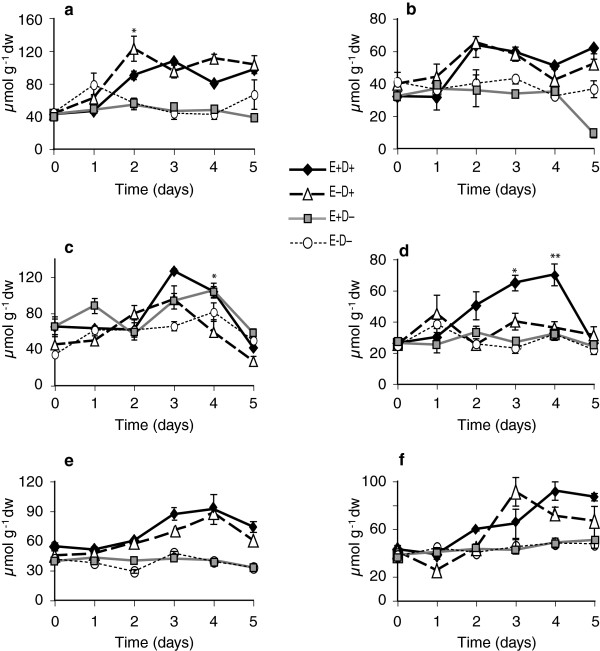
Figure 4.
Sucrose levels in water-deficit stressed and unstressed shoots and roots of tall fescue. (a and b) Shoots and roots, respectively, of 278/279 clone pair, Experiment 1; (c and d) shoots and roots, respectively, of 278/279 clone pair, Experiment 2; (e and f) shoots and roots, respectively, of 4607/4608 clone pair. Abbreviations are as in Figure 2. Statistical significance is indicated as in Figure 1. Error bars are SEM of biological replicates as indicated in Figure 2.

