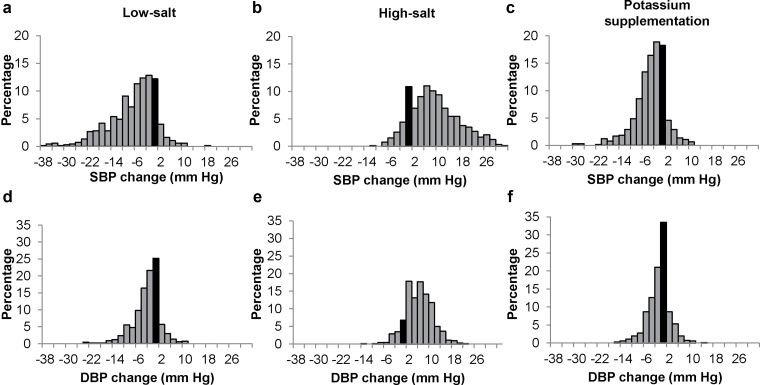
Figure 1.
Distribution of systolic blood pressure (SBP) (upper panel, a–c) and diastolic blood pressure (DBP) (lower panel, d–f) responses to low-salt intervention (left panel), high-salt intervention (middle panel), and potassium supplementation (right panel). Black bars indicate individuals with zero blood pressure (BP) response. BP response to low salt = BP on low-salt diet – BP at baseline; BP response to high salt = BP on high-salt diet – BP on low-salt diet; and BP response to potassium supplementation = BP on high-salt diet with potassium supplementation – BP on high-salt diet.

