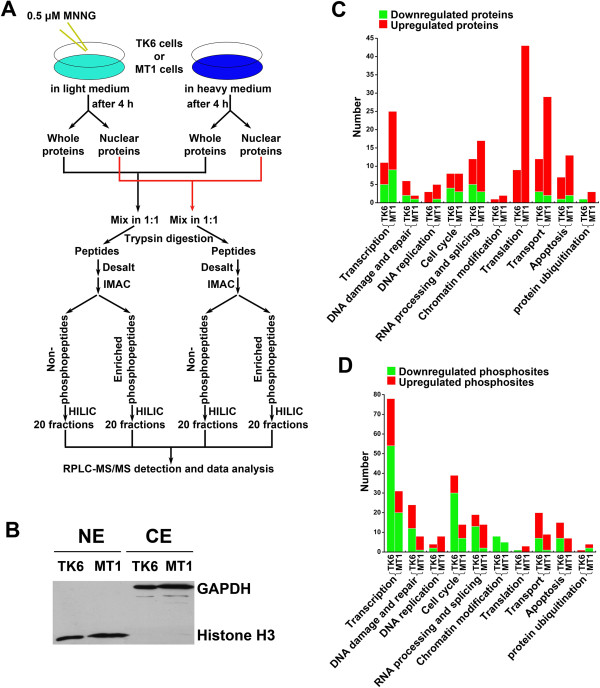
Figure 2.
Experimental strategy and overview of changed nuclear proteins in TK6 and MT1. (A) Strategy for the identification and quantification of phosphorylation stoichiometry and protein abundance in TK6 and MT1 at 4 h after 0.5 μM MNNG treatment. (B) Validation of nuclear-extract’s purity using antibodies of GAPDH and Histone H3. (C) Functional distribution of changed proteins in TK6 and MT1. All the up- or down-regulated proteins from MNNG-treated TK6 and MT1 nuclear proteome were analyzed through their biological process distribution based on Gene Ontology (GO) annotation. (D) Functional distribution of changed phosphosites in TK6 and MT1. All the up- or down-regulated phosphosites from MNNG-treated TK6 and MT1 nuclear proteome were analyzed through their biological process distribution based on Gene Ontology (GO) annotation.

