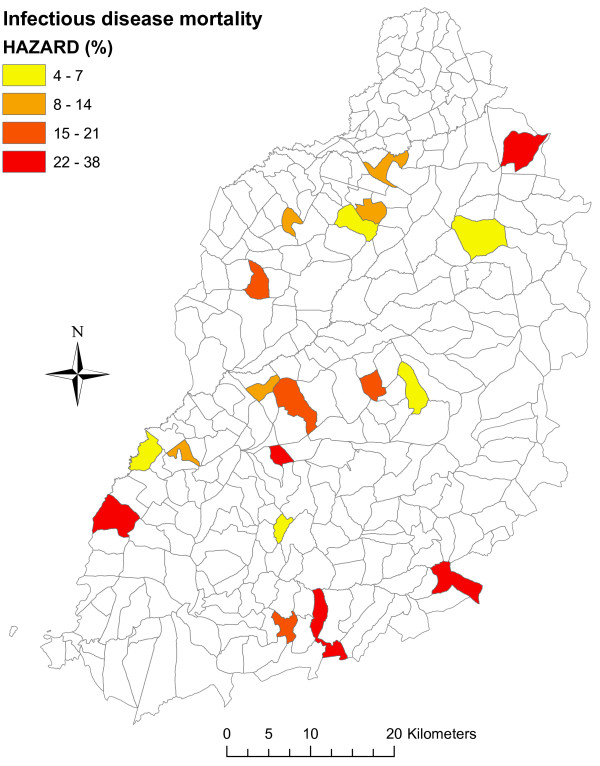
Figure 4.
Choropleth map showing mortality rates by study sub-location. Higher mortality rates observed in sub-locations in the South, and lower rates in sub-locations towards North. The variable “Northing” is marginally statistically associated with calf mortality (p-value = 0.078). The north most sub-location (East Siboti) has a high mortality and masks the observed association between mortality and northing (p-value = 0.007, when East Siboti is omitted).

