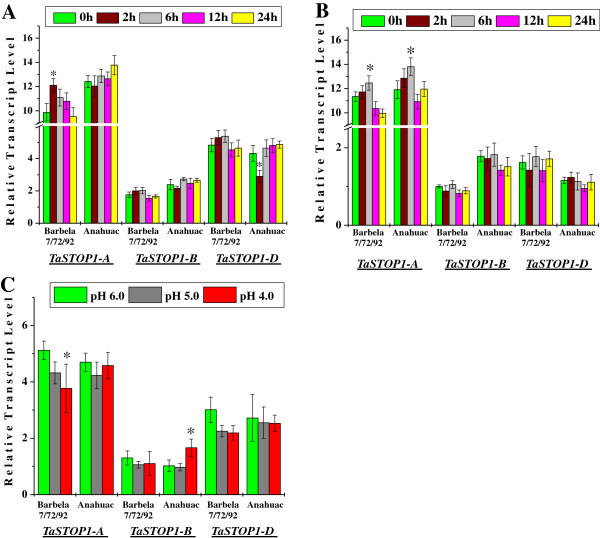
Figure 6.
Relative transcript level (fold change) of TaSTOP1 homoeologues genes under Al stress in the roots (A) as well as shoots (B) and under proton (H+) stress in roots (C) of two bread wheat genotypes Barbela 7/72/92 and Anahuac. Among three homoeologues, the lowest Δ Ct value of a TaSTOP1 homoeologue [TaSTOP1-B in shoots of Barbela 7/72/92 (0 h; as control) and in roots of Anahuac (pH 6.0; as control) for Al and pH stress assay, respectively] was used as calibrator. Values are means (± SD) of three independent replicates. Asterisks indicate significant difference between the control and treatment sample in the respective genome of a genotype (Student´s t test, * P < 0.01).

