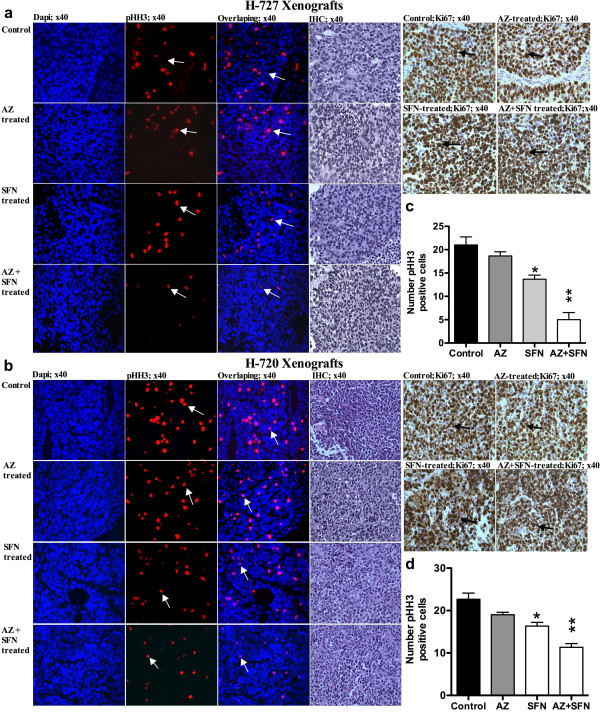
Figure 3.
AZ and SFN Inhibit Tumor Progression in Lung Carcinoid Xenografts: figures (a, b, c, d) and (g, h, i , j, k) represent the volume, morphology, weight, H&E (×10) and ultrastructure (× 104; nu, represents the nucleous and arrow, represent the cytoplasmic dense-core vesicles) of H-727 and H-720 xenografts, respectively. Figures (f and l) represent the number of dense-core vesicles after treatment with AZ and/or SFN compare to untreated group in H-727 and H-720 xenografts, respectively.

