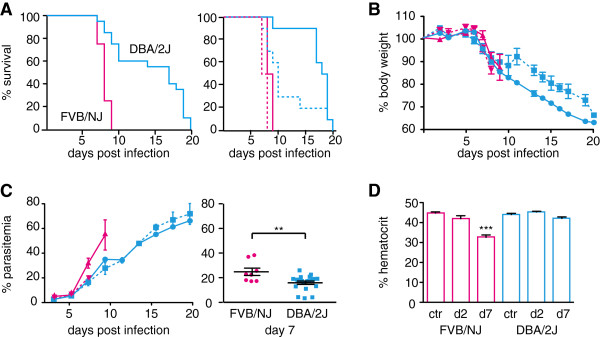
Figure 1.

Phenotypic analysis of DBA/2J and FVB/NJ mice. Ten male and ten female DBA/2J (blue) and four male and four female FVB/NJ (pink) mice were infected with P. berghei. Mice were monitored twice daily. A. Survival for total FVB/NJ and DBA/2J mice, the right graph shows the survival curves for the female (dotted line) and the male mice (solid lines) separately. B. The loss of body weight over the course of infection. C. Parasitaemia was measured every second day starting on day three post infection. The graph on the right shows parasitaemia for FVB/NJ and DBA/2J mice on day seven. D. Haematocrit measured in control mice (ctr) or in infected mice on day two and seven post infection (d2, d7). Shown are the averages with the standard error. Stars indicate statistical significance by unpaired Student’s t test (A, C) or one-way ANOVA with Dunnett’s post-hoc test compared to the control (D), ** p > 0.01, *** p > 0.001. Statistical differences regarding survival curves and progress of parasitaemia and body weight are discussed in the text.
