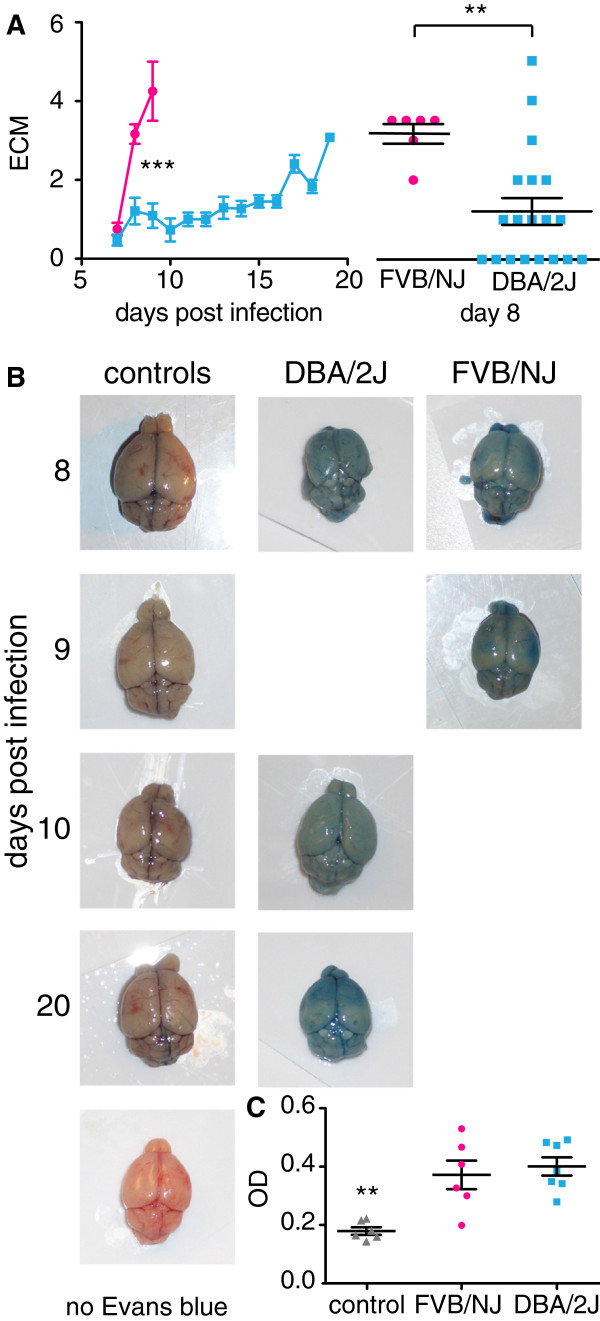
Figure 2.
Experimental cerebral malaria in FVB/NJ and DBA/2J mice. Mice were scored twice daily for symptoms of ECM. A. Average ECM scores over the course of infection with standard errors. The inset shows statistically significant differences in ECM scores on day eight (Linear regression model, *** p < 0.001 and Mann-Whiney-Wilcoxon Rank Sum test, ** p > 0.01). B. Mice with ECM scores of 3.5 or higher were injected with Evans blue 60 minutes prior to dissection. Representative images of brains from infected mice and uninfected control mice are shown. The days post infections are indicated on the left. The bottom control shows a brain without Evans blue injection prior to dissection. C. Evans blue was extracted from the brains and the absorption was measured. Shown are the averages with the standard error (one-way ANOVA with Dunnett’s post-hoc test compared to the control, ** p > 0.01).

