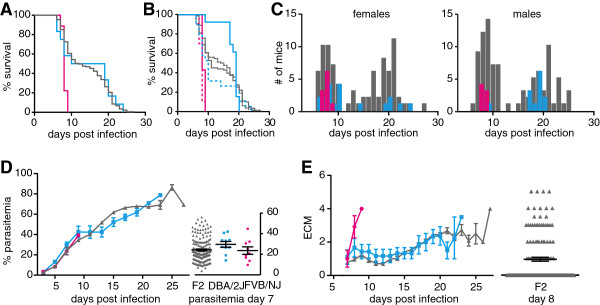
Figure 5.

Phenotypic analysis of F2 cross between DBA/2J and FVB/NJ. 175 F2, twelve DBA/2J and nine FVB/NJ mice were infected and monitored twice daily. A. Survival for total DBA/2J (blue), FVB/NJ (pink) and F2 (grey) mice. B. Survival for male (solid lines) and female (dotted lines) mice. C. Distribution of survival for female (left) and male mice (right), colors as in A. D. Course of parasitaemia during infection and on day seven on the right. E. ECM scores over the course of infection with distribution of ECM scores for F2 mice on day eight to the right. Shown are the averages with the standard errors. Statistical analyses are discussed in the text.
