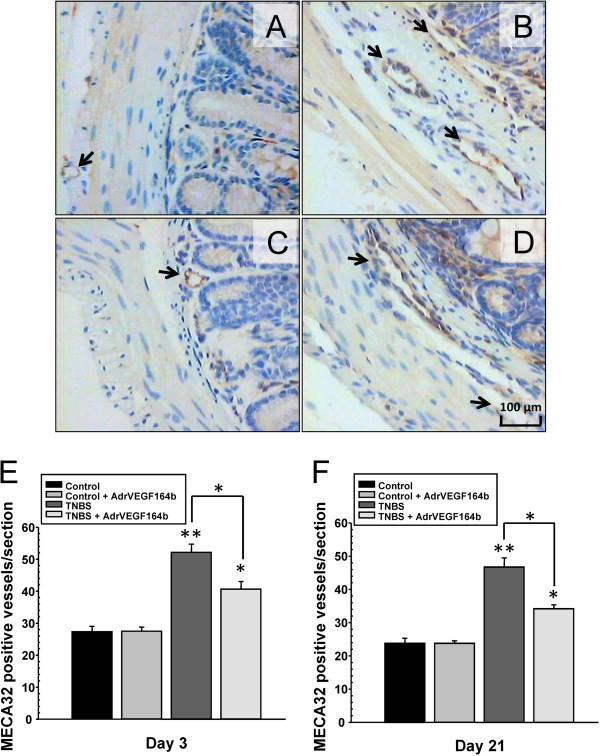
Figure 4.
Evaluation of blood vessel density in the TNBS model of UC. Representative images of colon sections (20× magnification) are shown from control (A), TNBS (B), Ad5-CMV-rVEGF164b(C) and TNBS + Ad5-CMV-rVEGF164b(D) mice immunostained with stained with MECA-32. Angiogenesis was quantified at day 3 (E) and day 21 (F) of disease; n = 5.

