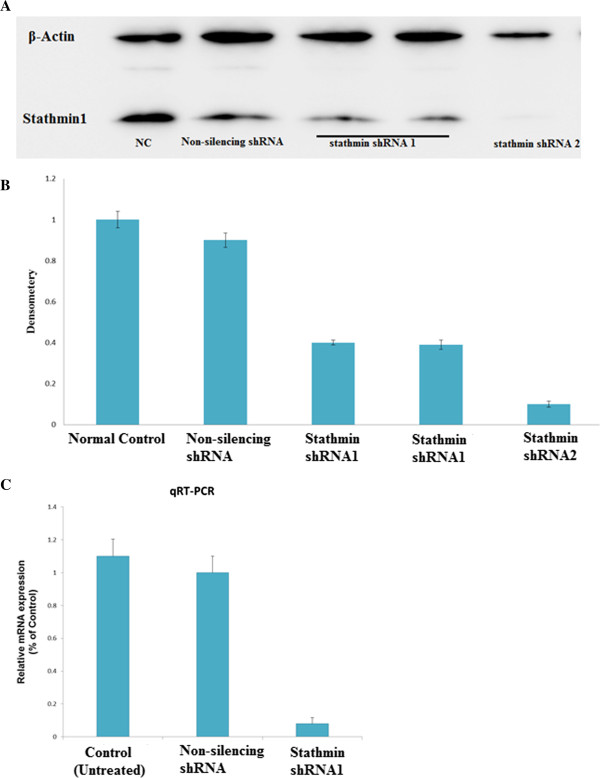
Figure 2.

Western blot Assay and qRT-PCR analysis of gastric cancer-derived cell lines MKN-45 with Non-silencing shRNA and stathmin shRNA knockdown. (A) MKN-45 cells were transfected with two different Stathmin1-specific shRNA or with a Non-silencing shRNA. Forty-eight hours after transfection, the cells were analyzed by western blotting for stathmin1 (B) Densitometry analysis of Western blots from three independent experiments, respectively, showing that stathmin1 shRNA specifically knockdown stathmin1 expression in gastric cancer cell lines (C) Bar graph showing qRT–PCR analysis of cells transfected with the shRNA2 using primers specific for stathmin1 or β-actin mRNA. stathmin 1 shRNA2 significantly down-regulate stathmin mRNA level as compared with Control or transduction with Non-silenecing shRNA in MKN-45 cell lines. Data are expressed as percentage change (Means ± S.D.) compared with controls and represent four independent experiments. (P < 0.05 vs Non-silencing shRNA, one-way analysis of variance (ANOVA) followed by Tukey’s multiple comparion).
