Figure 3.

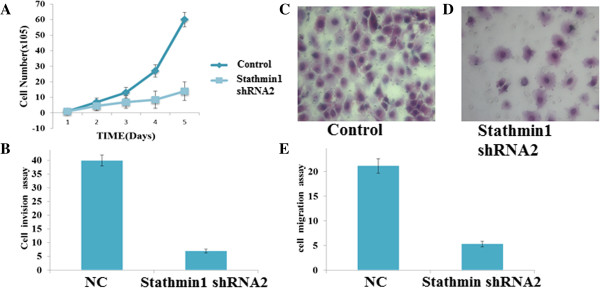
Knockdown of stathmin 1 inhibited gastric cancer cell proliferation, invasion and migration. (A) Proliferation curve of a MKN-45 cell line following transfection with specific stathmin1 shRNA was determined using CCK-8 assay, 96 hours after transfection. Values are normalized against the Non-silencing shRNA-negative control. (B) Cell invasion was evaluated in the Matrigel invasion. Data are expressed as percentage change (Means ± S.D.) compared with controls and represent four independent experiments. (P < 0.05 vs Non-silencing shRNA, one-way analysis of variance (ANOVA) followed by Tukey’s multiple comparion). (C) &(D) Cell migration was evaluated in the Boyden migration assay two days after MKN-45 cells were transfected with Non-silencing short hairpin RNA (shRNA) or stathmin1 shRNA. (E) Shows that untreated MKN-45 were significantly migrated across the wells as compared with stathmin1 shRNA (P < 0.05).
