Figure 2.
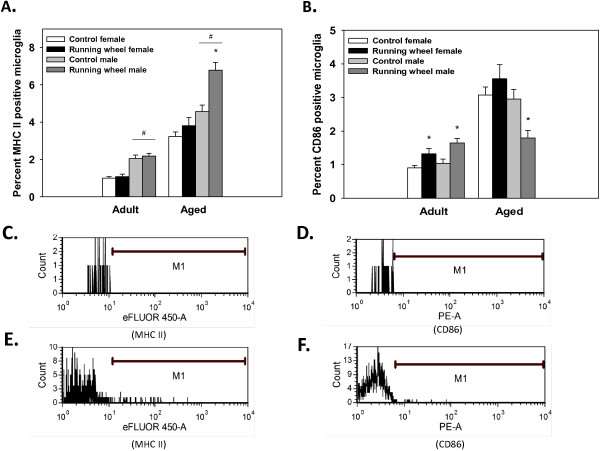
Proportion of brain microglia positive for MHC II and CD86 in Experiment 1. (A) Average proportion of microglia isolated from the brains of running-wheel mice and control mice that were positive for MHC II. Aged males (n=7), but not aged females (n=7) or adult mice (males n=9, females n=9), showed an increase in the proportion of MHC II positive microglia from running-wheel access. (B) Average proportion of microglia isolated from the brains of running-wheel mice and control adult and aged mice that were positive for CD86. Aged males, but not females, showed a significant reduction in the proportion of CD86 positive microglia from running. Bars represent means ± SEM. * indicates a significant difference from age- and sex-matched control mice. # indicates a significant difference from age-matched female mice. (C) Histogram of MHC II signal intensity from non-stained control sample; M1 indicates the gate for the MHC II positive cells. (D) Histogram of CD86 signal intensity from non-stained control sample; M1 indicates the gate. (E) Histogram of representative hippocampal sample labeled for MHC II. (F) Histogram of representative hippocampal sample labeled for CD86.

