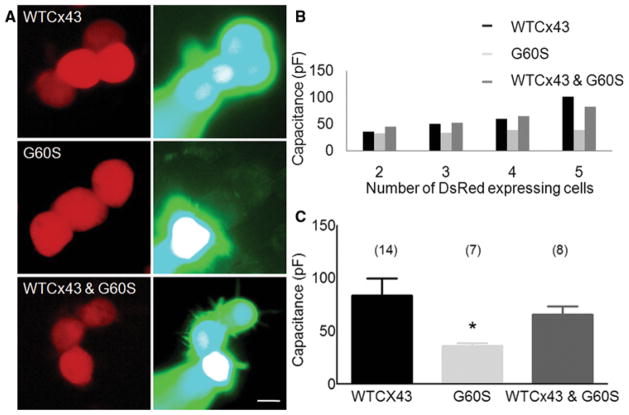
Fig. 3. G60S does not have dominant effects on coupling in cells transfected to express both G60S and WTCx43.
N2A cells were transiently transfected to express WTCx43 (in pIRES2–DsRed) alone, G60S (in pIRES2–DsRed) alone, or both G60S (in pIRES2–DsRed) and WTCx43 (in pIRES2–puro3). (A) Clusters of DsRed cells were identified with TRITC optics (left column), one cell was patched with an electrode containing 0.1% LY, and imaged after 5 min (right column). Cells expressing WTCx43 alone or WTCx43 and G60S show robust dye transfer, but cells expressing G60S alone show no dye transfer. Scale bar: 10 μm. (B) The capacitance transients (in response to a 10 mV pulse) increase progressively in DsRed-positive cell clusters expressing WTCx43 or both WTCx43 and G60S, but not in cells expressing G60S alone. (C) Compared to cells expressing WTCx43, a Kruskal–Wallis test shows a statistically significant difference for cells expressing G60S alone (asterisk; P < 0.0165), but no significant difference for cells expressing both WTCx43 and G60S.

