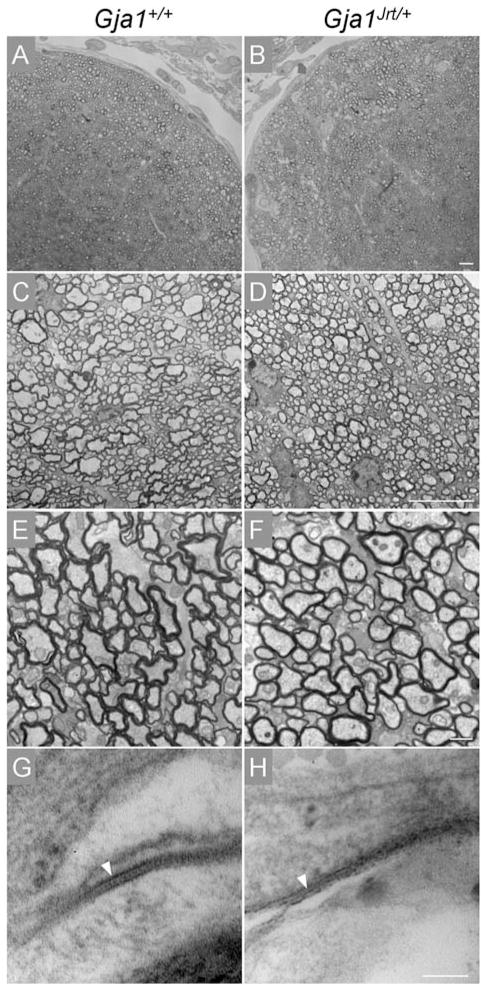
Fig. 7. Normal myelination in Gja1Jrt/+ CNS.
These are digital images of individual optic nerves from P40 Gja1Jrt/+ mice (n = 3) and their Gja1+/+ littermates (n = 3). Panels A and B show toluidine blue stained semi-thin sections. Panels C–H show electron micrographs from thin sections; C–F show that the myelinated axons in Gja1Jrt/+ mice appeared similar to those in their WT littermates; G and H show GJs (arrowheads) between subpial astrocytes in Gja1Jrt/+ and Gja1+/+ mice. Scale bars: 10 μm in A–D; 1 μm in E and F, and 100 nm in G and H.

